Tailor-made dashboard for BAM Infra
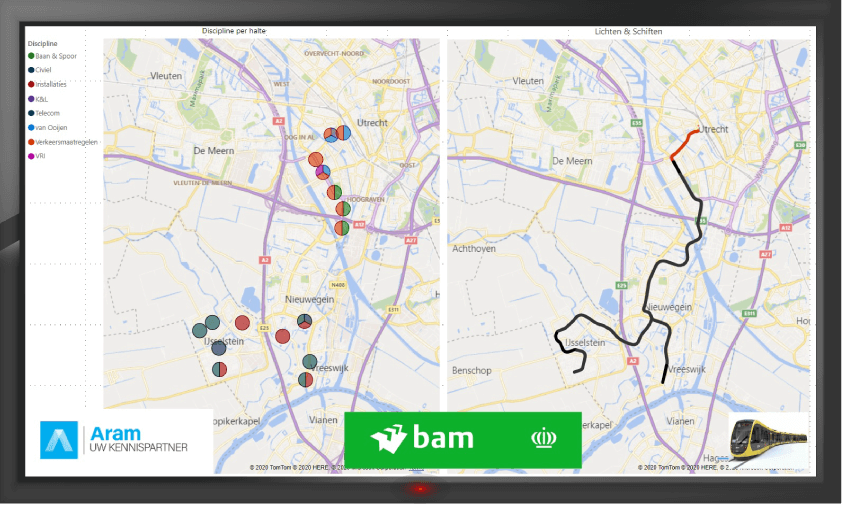
We recently set up and implemented a new dashboard for the SUNIJ project of BAM Infra. This dashboard is a visual representation of various data from this project, such as planning data combined with location data. In this way, the work that is carried out outside can also be properly monitored from other places. For example, you can see in real time where and which work is being carried out. This is useful on a project like this one where multiple subcontractors are working.
Integral project management dashboard
Our professionals have noticed for awhile, in conversations with our clients, that there is an increasing need for visualizing data from, for example, planning, risk files and ERP systems. In the planning and risk world, s-curves, tornado and distribution charts are often requested. But those separate programs do not always provide a clear and integral overview of a project. That is why we have started developing an integrated project management dashboard. For example, in this dashboard we provide insight into activities, risks, interfaces and restrictions in a different way. Think of an interactive map display or a 3D model. It works as a reporting tool and it is also a nice tool of communication to inform stakeholders who are less involved in a project.


