
What is Turbo-Chart?
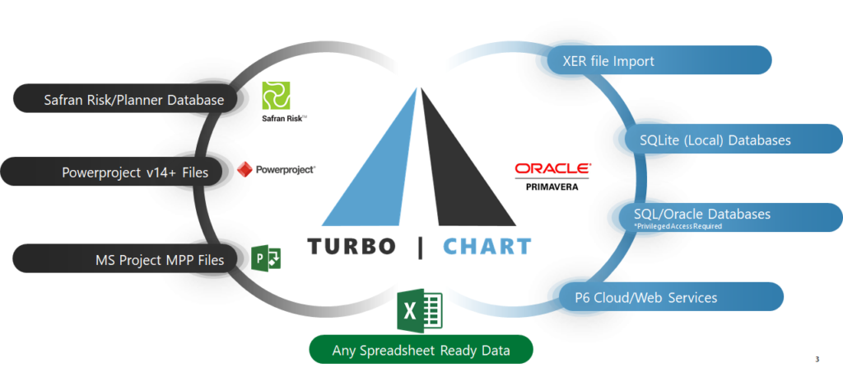
Turbo-Chart is a software application that allows you to easily create a time-way diagram or Line of Balance (LOB) diagram based on existing project schedules within minutes. Turbo-Chart is designed so that you can continue to use existing planning tools, such as Primavera P6, MS Project, Asta PowerProject and Safran. Data exchange between your planning tool and Turbo-Chart is possible without a costly interface.
Benefits
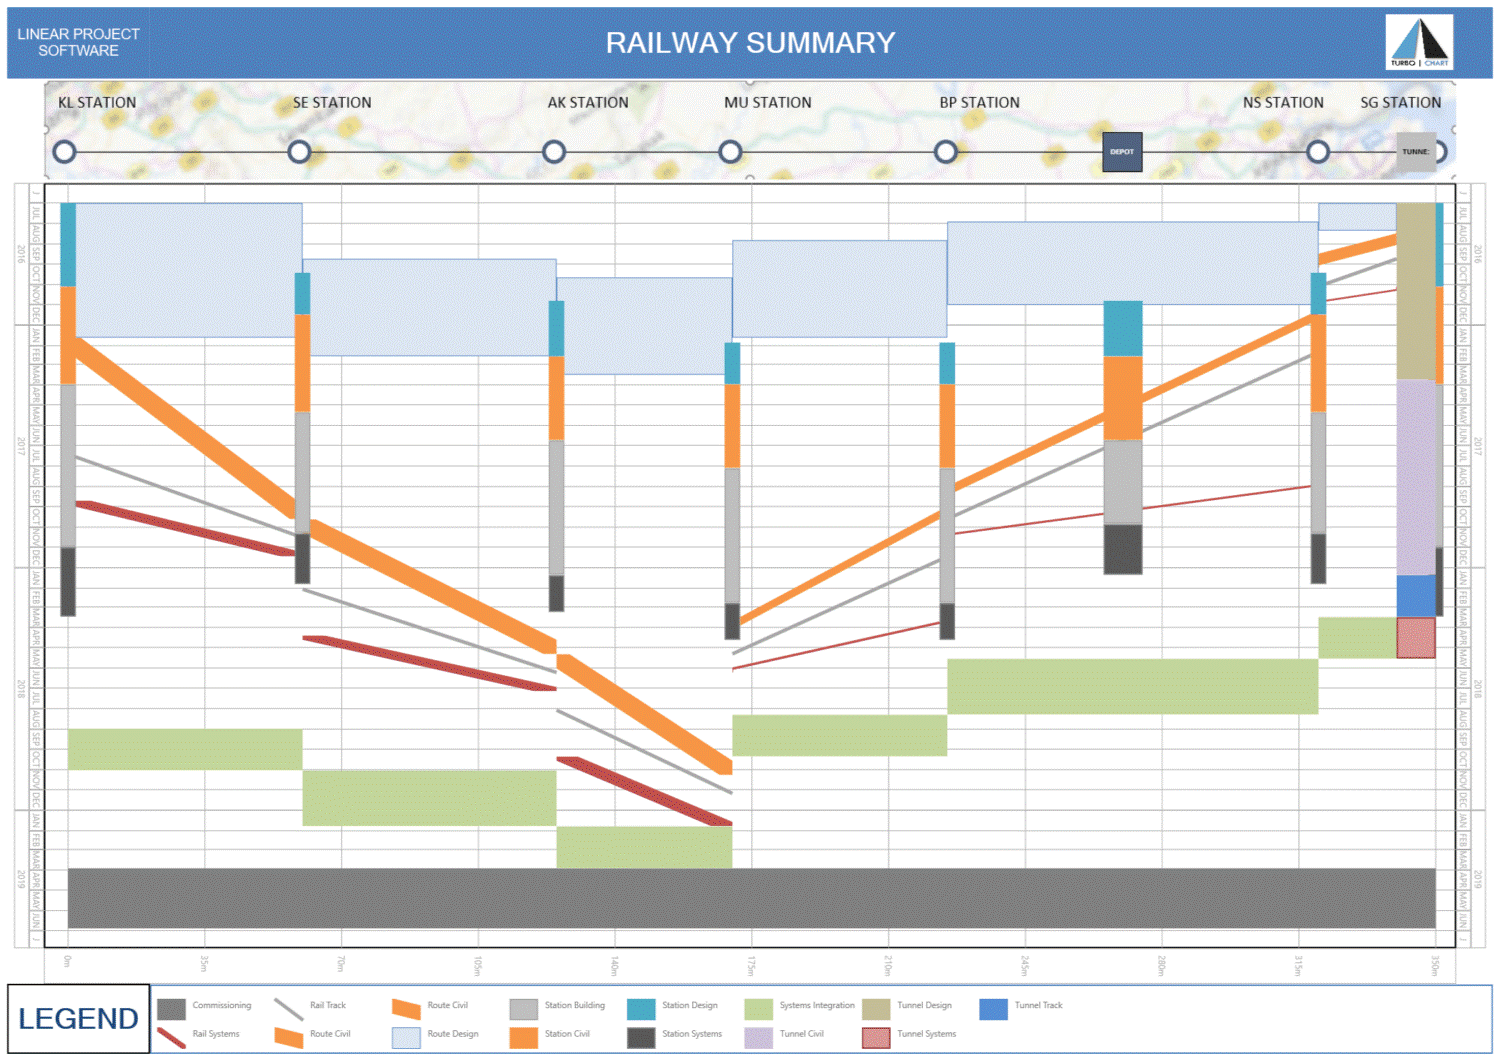
Visualize your entire project on one page
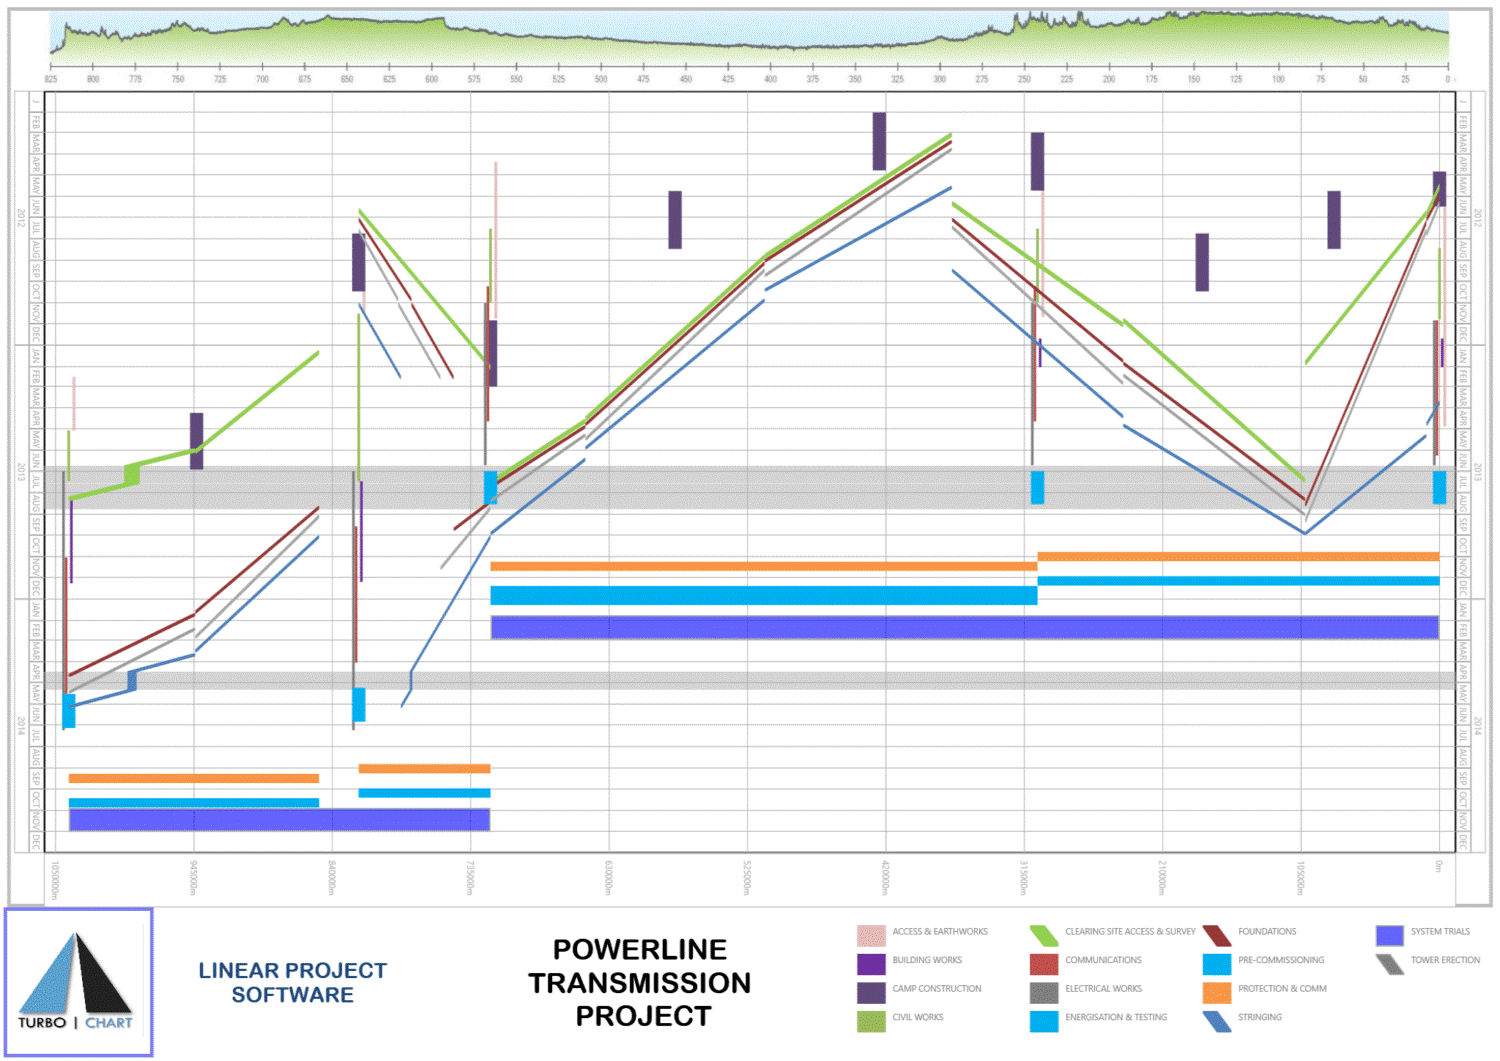
Display your project using a time-way diagram on just one page. Various shapes, colors and patterns are used to represent the different types of work.
Develop better Tender/MEAT planning
By using multiple data sets you can visualize the P85-data in your deterministic time-path diagram. This substantiates the risk strategy.
Professional
project control
Turbo-Chart enhances your existing scheduling capabilities, saving you time, cost and effort.
Optimal coordination between various parties
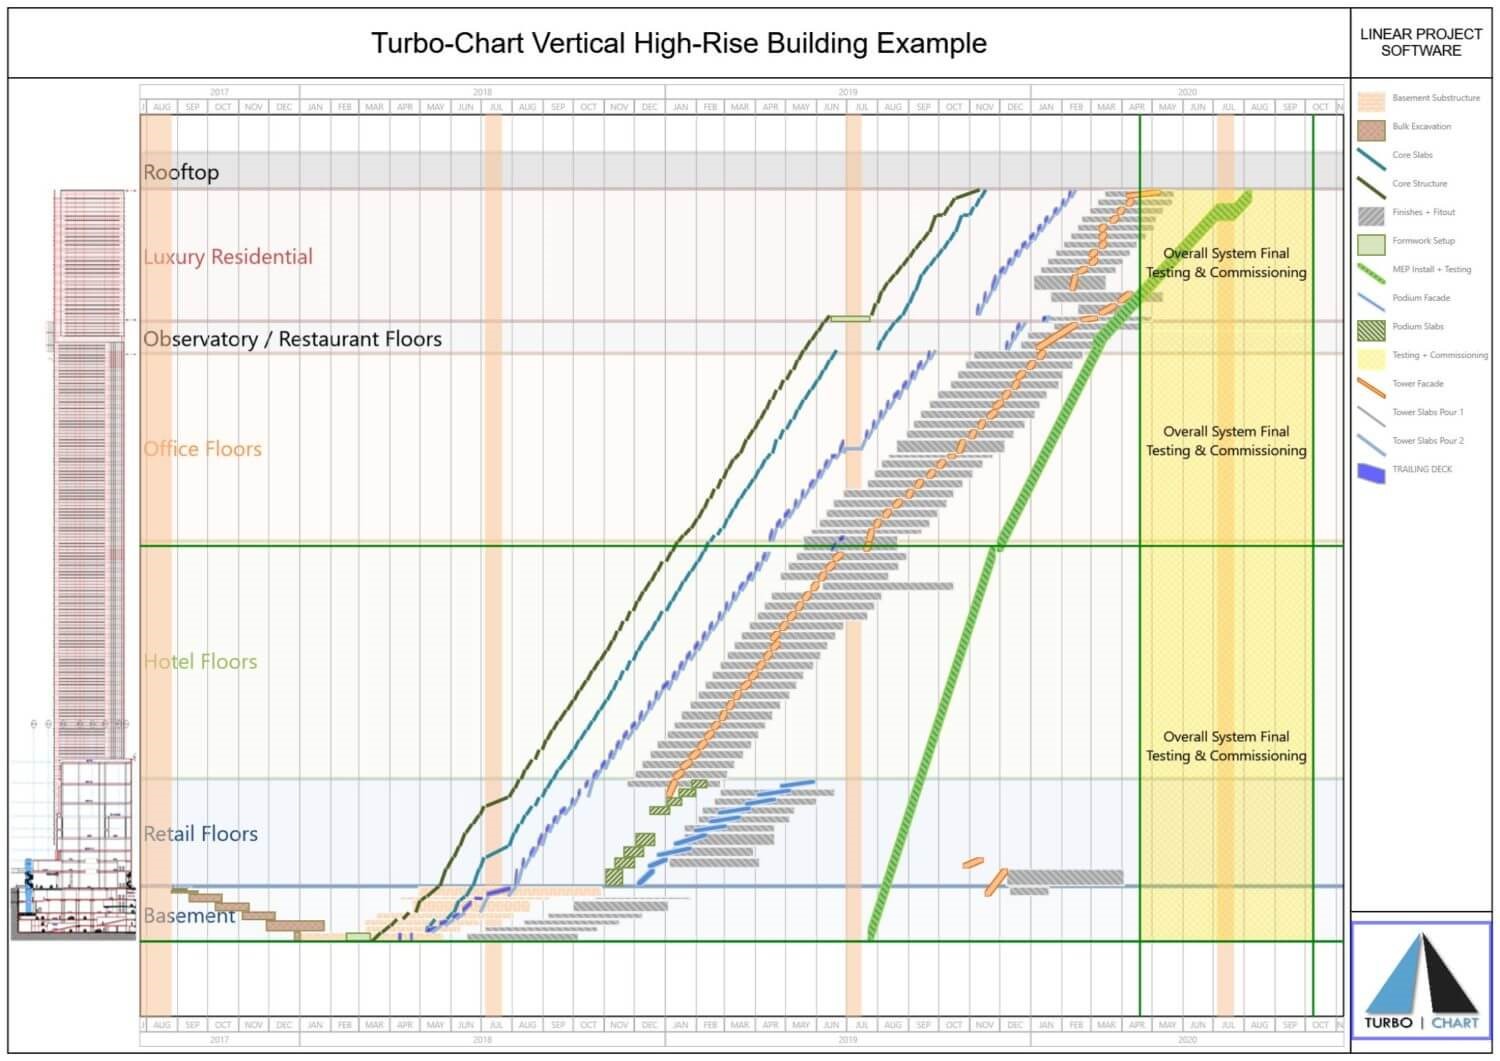
With Line of Balance diagram, you can optimize the coordination of multiple parties that perform activities in succession. Repetitive work, such as high-rise buildings, roads and pipelines are visualized.
Multiple charts and map orientations
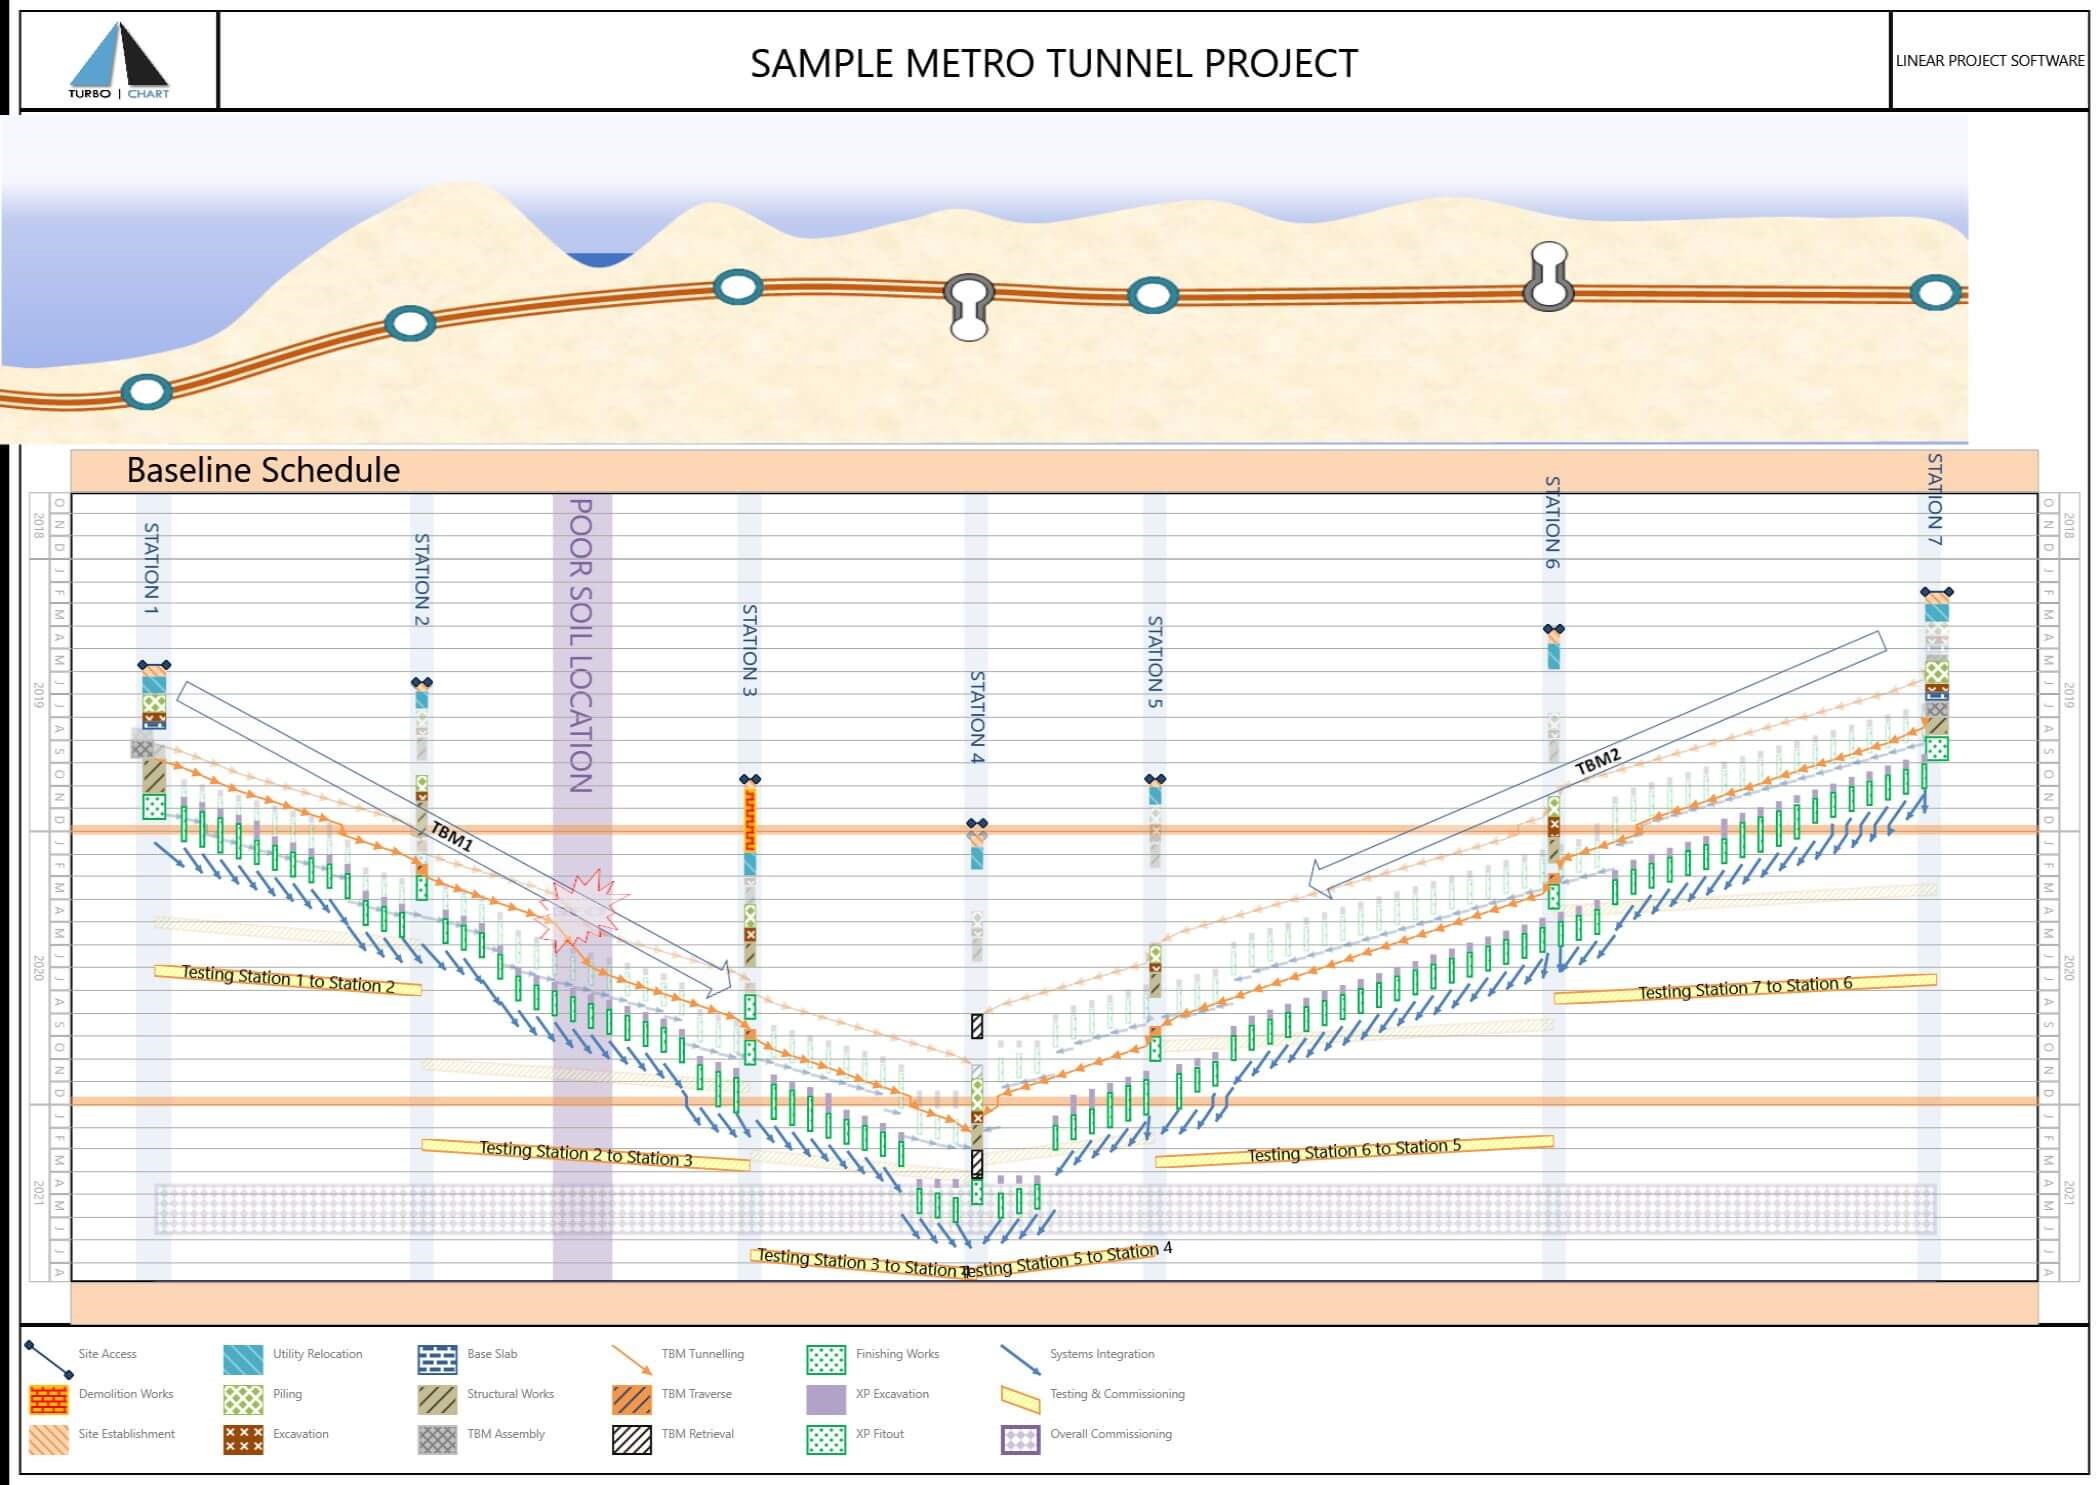
Turbo-Chart can easily import images, such as JPG files. In addition, you can create multiple charts from a schedule. For example, a summary of the total road project and a detailed map of all intersections.
Integrate and data
synchronize
You can create a time-way diagram from your existing planning software. If you later on make changes in, for example, Primavera P6 or Microsoft Project, you will immediately see those changes reflected in the time-path diagram in Turbo-Chart.
Do you want to know more about Turbo-Chart or try it yourself?
Why choose Turbo-Chart?
Fast integration with planning software
For optimal use of Turbo-Chart you only need linear project software. Other complicated, expensive software or error-prone manual drawing methods are a thing of the past.
Good communication and analysis tool
Bring hundreds or thousands of tasks from different parties together on one page that clearly shows the bigger picture to all stakeholders. A breakdown into detailed charts and maps is also possible.
Easy in use
The easiest and fastest way to create linear and time-path diagrams for linear projects.
Main functionalities
- Time-way diagram display support
Traditional time-way diagrams
Line of Balance (LOB) diagrams
Working with multiple datasets
Horizontal or vertical charts
Line, area, parallelogram and triangle visualizations
Customize colors and fill styles
Automatic legends
Filter possibilities
Free text fields
Integration options
with:

MORE INFORMATION
Contact us
Do you have any questions? Contact us. We are happy to help you.
Free quote
Curious about the license costs? We are happy to prepare a free offer.
Live demo
Would you like to see more of the functionalities? We are happy to give you a live demo. This can be done on site or remotely.
Free 14-day trial
See for yourself whether Turbo-Chart is the right solution for your business and receive a free 14-day trial version.
Support
Our support desk provides support with functional and technical questions about Turbo-Chart.