INFORMATIon MANAGEMENT
Information management at Aram
- Create and manage data
- Enriching and combining data
- Visualizing data
- Customized dashboard
Integrated project management dashboard
- Continuous up-to-date information
- Run easily reports
- Various dashboards immediately available
- Your data is guaranteed safe and privacy
Widely deployable professionals
- Data-analist
- Business analist
- Information manager
- Business Intelligence developer
THROUGH OUR EXPERIENCE WITH COMPLEX DATA, WE SEE OPPORTUNITIES TO VISUALISE INFORMATION IN A SMART WAY AND RUN REPORTS MORE EFFICIENTLY.
Smart linking of your data and processes in a visual dashboard
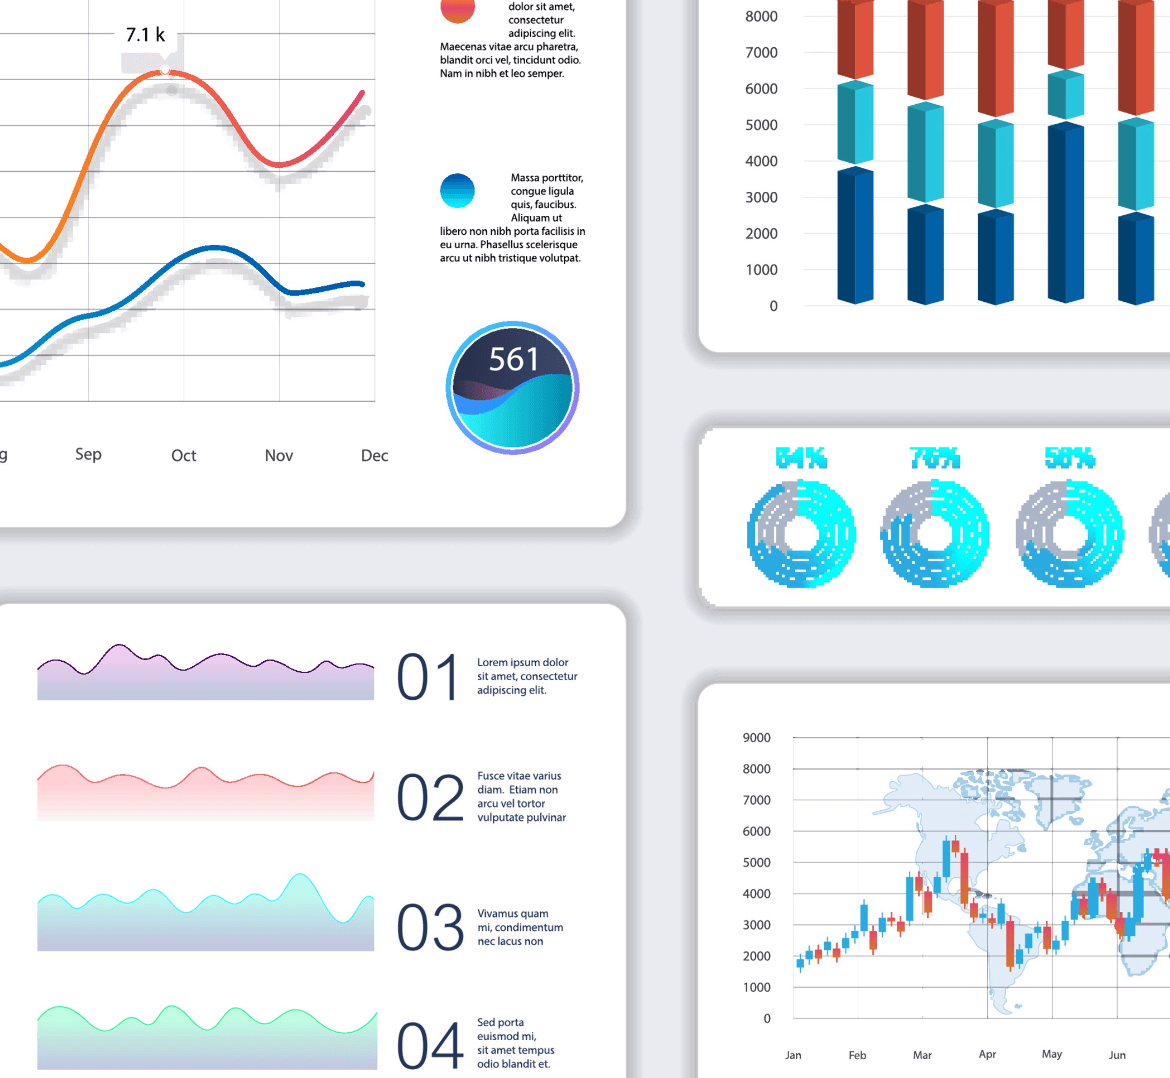
At Aram we follow developments in big data and business intelligence with great interest. Due to the enormous amount of data used by companies, the demand for automating and visualising information provision and information management is growing. In the planning and risk world is often asked for Gantt charts, s-curves, tornado and distribution charts. But those separate reports do not provide a clear and integral overview of a project. We are convinced of the added value of converting data into useful management information and visualising this data on an integral project management dashboard. For example, if you look at the full project itself and combine data from different systems about time, money, hours spent, risks, scope, resources and location in one clear dashboard, better and interesting insights often arise. This enables you to manage projects or organisations (even) more effectively and efficiently. In addition, the dashboard provides better insight into activities and risks. In this way you can easily report internally at different organisational levels and also present filtered data externally to other parties or stakeholders.
The way we work
Start by researching and clarifying exactly what the client wants to provide insight into this and what data is already available about it.
Check whether this data is already sufficiently secured in the organisation and whether it is of good quality.
If that is not the case, we first start by optimising the existing data.
Investigating which data sets we can combine, such as planning, risk files or data from an ERP system.
Validate the different datasets.
Where possible, we immediately enrich the existing data, so that it can also be used for other purposes.
Once all data is transparent, we can develop an integrated project management dashboard. In this dashboard we make the combined data clear. Think of a map view or a 3D model. This can be done in combination with standard displays, such as histograms and Gantt charts.
The dashboard also becomes interactive, so you can zoom in on certain information faster without losing the overall overview. This makes it easier to run better reports. Both internally for different organisational levels (departments or higher management) and for external parties and stakeholders.
Benefits of a custom integrated project management dashboard
Doing smart things with your data and turning it into an integrated project management dashboard provides many benefits. For example:
- Continuously view up-to-date information about projects
- Run easily reports for different organisational levels (departments and higher management)
- Quickly make customer reports available that can be accessed externally
- Live access to, for example, progress reports and the financial status of projects
- Avoid duplicate data, reducing errors
- Due to the secure environment, your data remains safe and unreachable for other parties
- By combining the various data in a smart way, you can make processes more efficient, steer more specifically and run better reports.
Data link with privacy
The offer our dashboards also in a cloud, so we can exchange data in a secure way and enrich your existing data. The data link with the dashboard can be set up based on your wishes and privacy guidelines, without having to purchase separate software yourself. The guaranteed privacy applies to the data and the end user. This means it is possible to arrange different access options for the various project team members and that both internal and external stakeholders can view in a protected and safe data environment.
Curious about what our professionals in Information Management can do for you?
Within Aram there is a dedicated development team working on the development of dashboards and information management.
Both substantively and technically, we are continuously developing and optimising this product and our services.
WE WORK FOR: