Started as a planner and expanded to data analyst
Two years ago, our colleague Mark Pathuis started the Traineeship Project control at Aram. After following an internal training course, he started working as a project planner during his first assignment. He could apply his learned knowledge in this project which gave him a confident feeling. Mark has now shifted, since completed several assignments, his focus from planning to data analysis. He likes the ability to expand his knowledge very much.
From raw data sets to useful reports
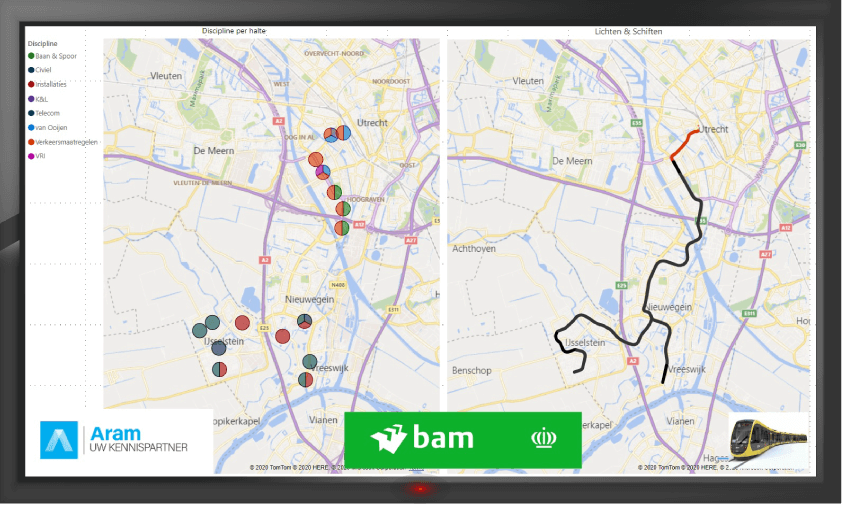
Mark talks enthusiastically about his approach: “I always start by exporting data from different systems like Navision, Primavera P6 and Microsoft Dynamics. I often find out the data is not complete or the correct information is not being retrieved. This leaves me to go looking for that information, until everything is complete. Once the datasets are good, I merge the different data files. After that, it is time for the analysis and creating reports which are useful at both operational and management level. These reports, for example, show the status of realization versus forecast or actuals versus baseline. This way you can see exactly where the opportunities lie to organise business processes more efficiently or where adjustments need to be made in terms of time, money, risks and/or resources. At the moment, I moslty make the analyses and reports in Excel by using applications such as PowerQuery and PowerPivot. In the future, I also want to use other, comparable software, like PowerBI.”
Planning and data analysis is a good combination
Mark continues his story: “Being able to properly link and analyse different types of data actually yields a lot for every company. As a project planner, I know which data is relevant for which issue. I notice the combination of planning and data analysis means adding value for the clients where I work. I look at things from a broader perspective and make other connections.”
A diverse competence package
Being versatile also requires a broad set of competencies and skills. Mark’s answer: “Yes, that’s actually true. For example, it requires certain software knowledge, analytical
thinking and good communication skills. The last one is often underestimated. I
think it is important to understand what insights my client is looking for and
what information is important to them. That means I have to be able to put myself in their role, work
and interests. I think moving yourself in the end user is something I already do naturally. I can
namely build everything, endlessly analysing and making a great diversity of reports, but
if no one does anything with it, it has little value and I actually do not help the company.”
Being able to properly link and analyse different types of data actually yields a lot for every company. As a project planner, I know which data is relevant for which issue.
Educational and fun
It’s cool when people are given the freedom and opportunity to broaden themselves in their work. Mark agrees: “I think
it’s really nice to work as a data analyst now. It requires a different way of analytic
thinking and a different set of competencies. Sometimes I am making jokes of the fact that I am puzzling all day. With the knowledge from my education, the traineeship and Excel training, I have expand myself. Of course I am also lucky that I am now at a job, where I learn a lot and have the
freedom and the confidence to set up new things. I do work which receives me a lot of energy. It’s great that Aram offers me the opportunity to develop myself more broadly. In short: a
suitable project and the freedom of my employer. I now have to deal with that ideal combination!”


